资源简介
MATLAB画矢量图,对整个矢量场进行插值,以箭头代表对应的方向,以颜色代表其大小。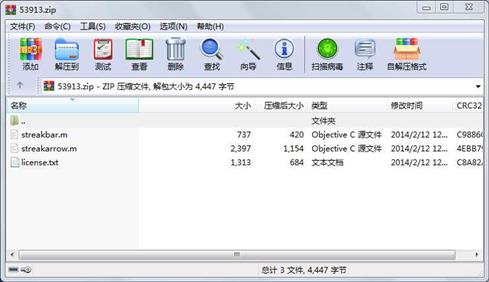
代码片段和文件信息
function hh=streakarrow(X0Y0UVnparrow)
%H = STREAKARROW(XYUVnparrow) creates “curved“ vectors from
% 2D vector data U and V. All vectors have the same length. The
% magnitude of the vector is color coded.
% The arrays X and Y defines the coordinates for U and V.
% The variable np is a coefficient >0 changing the length of the vectors.
% np=1 corresponds to a whole meshgrid step. np>1 allows ovelaps like
% streamlines.
% The parameter arrow defines the type of plot:
% arrow=1 draws “curved“ vectors
% arrow=0 draws circle markers with streaks like “tuft“ in wind tunnel
% studies
% Example:
%load wind
%N=5; X0=x(::N); Y0=y(::N); U=u(::N); V=v(::N);
%H=streakarrow(X0Y0UV1.50); box on;
% Bertrand Dano 10-25-08
% Copyright 1984-2008 The MathWorks Inc.
DX=abs(X0(11)-X0(12)); DY=abs(Y0(11)-Y0(21)); DD=min([DX DY]);
ks=DD/100; % Size of the “dot“ for the tuft graphs
np=np*10;
alpha = 5; % Size of arrow head relative to the length of the vector
beta = .25; % Width of the base of the arrow head relative to the length
XY=stream2(X0Y0UVX0Y0);
%np=15;
Vmag=sqrt(U.^2+V.^2);
Vmin=min(Vmag(:)); Vmax=max(Vmag(:));
Vmag=Vmag(:); x0=X0(:); y0=Y0(:);
%ks=.1;
cmap=colormap;
for k=1:length(XY)
F=XY(k); [L M]=size(F{1});
if L
if L==1
F1{1}=F{1}(L:);
else
F1{1}=F{1}(L-1:L:);
end
else
F0{1}=F{1}(1:np:);
F1{1}=F{1}(np-1:np:);
end
P=F1{1};
vcol=floor((Vmag(k)-Vmin)./(Vmax-Vmin)*64); if vcol==0; vcol=1; end
COL=[cmap(vcol1) cmap(vcol2) cmap(vcol3)];
hh=streamline(F0);
set(hh‘color‘COL‘linewidth‘.5);
if arrow==1&L>1
x1=P(11); y1=P(12); x2=P(21); y2=P(22);
u=x1-x2; v=y1-y2; u=-u; v=-v;
xa1=x2+u-alpha*(u+beta*(v+eps)); xa2=x2+u-alpha*(u-beta*(v+eps));
ya1=y2+v-alpha*(v-beta*(u+eps)); ya2=y2+v-alpha*(v+beta*(u+eps));
plot([xa1 x2 xa2][ya1 y2 ya2]‘color‘COL); hold on
else
rectangle(‘position‘[x0(k)-ks/2 y0(k)-ks/2 ks ks]‘curvature‘[1 1]‘facecolor‘COL ‘edgecolor‘COL)
end
end
axis image
%colorbar vert
%h=colorbar;
%set(h‘ylim‘[Vmin Vmax])
属性 大小 日期 时间 名称
----------- --------- ---------- ----- ----
文件 2397 2014-02-12 12:40 streakarrow.m
文件 737 2014-02-12 12:40 streakbar.m
文件 1313 2014-02-12 12:40 license.txt
- 上一篇:随机森林的matlab的预测Iris
- 下一篇:PDR算法MATLAB仿真
相关资源
- 高灵敏度GPS接收机MATLAB仿真,附捕获
- 基于MATLAB的质点弹道计算与外弹道优
- 阵列天线的matlab仿真
- MATLAB 经典程序源代码大全
- MATLAB小波软阈值去噪代码33473
- 天线阵的波束形成在MATLAB仿真程序及
- 非线性SVM算法-matlab实现
- 《MATLAB 智能算法超级学习手册》-程序
- 组合导航matlab程序
- 读取txt文件内容matlab代码实现
- Matlab实现基于相关的模板匹配程序
- matlab优化工具箱讲解
- 基于MATLAB的快速傅里叶变换
- 光纤传输中的分布傅立叶算法matlab实
- 基于matlab的图像处理源程序
- matlab 椭圆拟合程序
- 算术编码解码matlab源代码
- optical_flow 光流法 matlab 实现程序
- 引导图像滤波器 Matlab实现
- 分形几何中一些经典图形的Matlab画法
- OFDM系统MATLAB仿真代码
- SVM工具箱(matlab中运行)
- 图像小波变换MatLab源代码
- LU分解的MATLAB实现
- 冈萨雷斯数字图像处理matlab版(第三
- 替代数据法的matlab程序
- 用matlab实现的多站定位系统性能仿真
- 通过不同方法进行粗糙集属性约简m
- k近邻算法matlab实现
- matlab识别系统
 川公网安备 51152502000135号
评论
共有 条评论