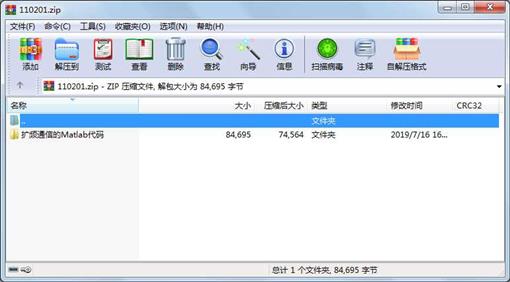
资源简介
扩频通信的Matlab仿真程序。
使用了GUI界面设计。
可使用三种伪随机码(m序列,gold码,walsh序列),可选择直接扩频或跳频方式来实现。

代码片段和文件信息
%直接扩频处理
function rec_seq=direct_spread(rand_x1pn_sequences_n)
figure(3);
clf;
gt=rand_x1.*pn_sequence; %直接扩频
subplot(211);
plot(gt);
axis([0 250 -2 2]);
title(‘扩频后的码序列‘);
grid on;

seq_length_1=length(gt);
n_sample_1=0:(seq_length_1-1);
f_1=n_sample_1*2*pi/seq_length_1;
subplot(212);
plot(f_1-piabs(fftshift(fft(gt))));
%axis([-100 100 0 2000]);
title(‘扩频后的码序列频谱图‘);
grid on;

sampling_2=20;
gt1=signal_sampling(gtsampling_2);%采样

seq_length=length(gt1);
%BPSK调制
fs=5e5;
f0=1e5;
AI=1;
cI=zeros(1seq_length);
for i=1:seq_length
    cI(i)=AI*cos(2*pi*f0*(i-1)/fs);
end
x_bpsk=gt1.*cI;

figure(4);
subplot(211);
plot(x_bpsk);
axis([400 600 -2 2]);
title(‘BPSK调制后的波形‘);
grid on;

%加噪模块
x_bpsk1=awgn(x_bpsks_n);%信噪比SNR为s_ndb
subplot(212);
plot(x_bpsk1);
axis([400 600 -2.5 2.5]);
title(‘加噪后已调波的波形‘);
grid on;

%解调模块
figure(5);
clf;
s=x_bpsk1.*cI*2;
subplot(211);
plot(s);
axis([400 600 -3 3]);
title(‘经解调后的波形‘);
grid on;

%低通滤波
wn=0.5/pi;  %截止频率wn=fn/(fs/2),这里fn为扩频码的带宽5M
b=fir1(12wn);
x_recovery=filter(b1s);
subplot(212);
plot(x_recovery);
axis([400 600 -3 3]);
title(‘经滤波后的波形‘);
grid on;

x_recovery_1=x_recovery(round(sampling_2/2):sampling_2:end);%抽样
%相关解扩
jk_code=x_recovery_1.*pn_sequence;
rec_seq=jk_code;


%频谱图
figure(6);
clf;
n_sample=0:(seq_length-1);
f=n_sample*2*pi/seq_length;
subplot(221);
plot(f-piabs(fftshift(fft(x_bpsk))));
%axis([-2.5 2.5 0 1000]);
title(‘bpsk已调波的频谱图‘);
grid on;

subplot(222);
plot(f-piabs(fftshift(fft(x_bpsk1))));
%axis([-2.5 2.5 0 1000]);
title(‘加噪已调波的频谱图‘);
grid on;

subplot(223);
plot(f-piabs(fftshift(fft(s))));
%axis([-2.5 2.5 0 1000]);
title(‘解调后的频谱图‘);
grid on;

subplot(224);
plot(f-piabs(fftshift(fft(x_recovery))));
%axis([-100 100 0 2000]);
title(‘滤波后信号的频谱图‘);
grid on;

figure(7);
clf;
subplot(211);
plot(jk_code);
axis([0 seq_length_1*1.1 -2 2]);
title(‘解扩后的波形‘);
grid on;

subplot(212);
plot(f_1-piabs(fftshift(fft(jk_code))));
%axis([-100 100 0 2000]);
title(‘解扩后波形的频谱图‘);
grid on;
end
属性 大小 日期 时间 名称
----------- --------- ---------- ----- ----
目录 0 2019-07-16 16:32 扩频通信的Matlab代码\
文件 2245 2019-05-26 14:28 扩频通信的Matlab代码\direct_spread.m
文件 1543 2019-05-26 13:46 扩频通信的Matlab代码\freq_hopping.m
文件 1757 2019-05-26 10:44 扩频通信的Matlab代码\my_seq.m
文件 69785 2019-05-26 13:57 扩频通信的Matlab代码\my_work.fig
文件 8238 2019-05-26 13:57 扩频通信的Matlab代码\my_work.m
文件 101 2019-07-16 16:34 扩频通信的Matlab代码\readme.txt
文件 330 2019-05-26 12:11 扩频通信的Matlab代码\rec_signal_jud.m
文件 424 2019-05-23 12:26 扩频通信的Matlab代码\select_freq.m
文件 272 2019-05-26 09:22 扩频通信的Matlab代码\signal_sampling.m
相关资源
- matlab_OFDM调制解调(来自剑桥大学)
- Matlab路面裂缝识别69319
- 高灵敏度GPS接收机MATLAB仿真,附捕获
- 基于MATLAB的质点弹道计算与外弹道优
- 阵列天线的matlab仿真
- MATLAB 经典程序源代码大全
- MATLAB小波软阈值去噪代码33473
- 天线阵的波束形成在MATLAB仿真程序及
- 非线性SVM算法-matlab实现
- 《MATLAB 智能算法超级学习手册》-程序
- 组合导航matlab程序
- 读取txt文件内容matlab代码实现
- Matlab实现基于相关的模板匹配程序
- matlab优化工具箱讲解
- 基于MATLAB的快速傅里叶变换
- 光纤传输中的分布傅立叶算法matlab实
- 基于matlab的图像处理源程序
- matlab 椭圆拟合程序
- 算术编码解码matlab源代码
- optical_flow 光流法 matlab 实现程序
- 引导图像滤波器 Matlab实现
- 分形几何中一些经典图形的Matlab画法
- OFDM系统MATLAB仿真代码
- SVM工具箱(matlab中运行)
- 图像小波变换MatLab源代码
- LU分解的MATLAB实现
- 冈萨雷斯数字图像处理matlab版(第三
- 替代数据法的matlab程序
- 用matlab实现的多站定位系统性能仿真
- 通过不同方法进行粗糙集属性约简m
 川公网安备 51152502000135号
评论
共有 条评论