资源简介
心电图及matlab实现 巴特沃斯低通滤波器 心电图及matlab实现

代码片段和文件信息
clear all;
clc;

load data.txt;   %原信号

subplot(311)
plot(data);
title(‘原始信号‘);
grid on;
Fs=999;     %采样频率
fc=50;      %50Hz
x=0:1/Fs:1;
y1=0.2*sin(2*pi*fc*x)‘+data;
subplot(312)
plot(xy1);
title(‘加入50Hz正弦噪声‘);
grid on;

fp=[45 55];fs=[49 51];         %fp 通带上下截止频率  %fs 阻带上下截止频率
wp=fp*2/Fs;ws=fs*2/Fs;  %wp 通带边界频率 ws 阻带边界频率
rp=3;   %通带最大衰减
as=14;  %阻带最小衰减
[nwc]=buttord(wpwsrpas);   % n 滤波器阶数 wc 3dB截止频率
[ba]=butter(nwc‘stop‘);    %b 系统函数分子
y2=filter(bay1);            %一维数字滤波器  输入X为滤波前序列,Y为滤波结果序列,B/A 提供滤波器系数,B为分子, A为分母
subplot(313)
plot(xy2);
title(‘巴特沃斯‘);
grid on

%滤波波形频谱
figure(2)
L=1000;
NFFT = 2^nextpow2(L);
Y = fft(y2NFFT)/L;
f = Fs/2*linspace(01NFFT/2+1);
subplot(311)
plot(f2*abs(Y(1:NFFT/2+1)))
title(‘频谱‘)


[h1w1]=freqz(ba1000);     % w是频率,n是FFT点数  计算系统的频率响应
subplot(312)
plot(w1/piabs(h1))        %幅度特性曲线
title(‘离散系统幅频特性曲线‘)
subplot(313)
plot(w1/piangle(h1));       %频率特性曲线
title(‘离散系统相频特性曲线‘)
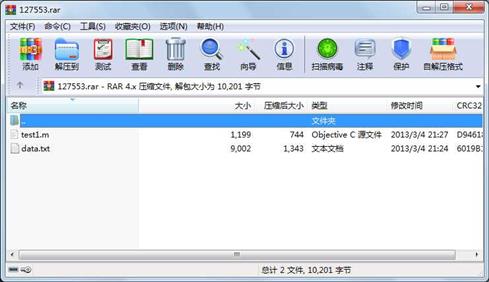
属性 大小 日期 时间 名称
----------- --------- ---------- ----- ----
文件 9002 2013-03-04 21:24 data.txt
文件 1199 2013-03-04 21:27 test1.m
----------- --------- ---------- ----- ----
10201 2
- 上一篇:IMM.m交互式多模型
- 下一篇:深度置信网络时间序列预测.zip
相关资源
- matlab_OFDM调制解调(来自剑桥大学)
- Matlab路面裂缝识别69319
- 高灵敏度GPS接收机MATLAB仿真,附捕获
- 基于MATLAB的质点弹道计算与外弹道优
- 阵列天线的matlab仿真
- MATLAB 经典程序源代码大全
- MATLAB小波软阈值去噪代码33473
- 天线阵的波束形成在MATLAB仿真程序及
- 非线性SVM算法-matlab实现
- 《MATLAB 智能算法超级学习手册》-程序
- 组合导航matlab程序
- 读取txt文件内容matlab代码实现
- Matlab实现基于相关的模板匹配程序
- matlab优化工具箱讲解
- 基于MATLAB的快速傅里叶变换
- 光纤传输中的分布傅立叶算法matlab实
- 基于matlab的图像处理源程序
- matlab 椭圆拟合程序
- 算术编码解码matlab源代码
- optical_flow 光流法 matlab 实现程序
- 引导图像滤波器 Matlab实现
- 分形几何中一些经典图形的Matlab画法
- OFDM系统MATLAB仿真代码
- SVM工具箱(matlab中运行)
- 图像小波变换MatLab源代码
- LU分解的MATLAB实现
- 冈萨雷斯数字图像处理matlab版(第三
- 替代数据法的matlab程序
- 用matlab实现的多站定位系统性能仿真
- 通过不同方法进行粗糙集属性约简m
 川公网安备 51152502000135号
评论
共有 条评论