资源简介
MATLAB实现的二维核密度估计。 输入平面样本点,得到概率密度函数。 2D Kernel Density Estimation。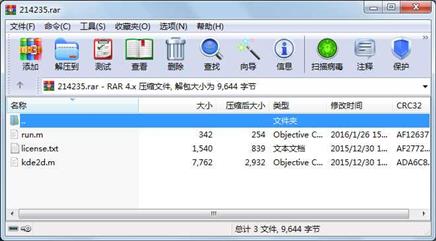
代码片段和文件信息
function [bandwidthdensityXY]=kde2d(datanMIN_XYMAX_XY)
% fast and accurate state-of-the-art
% bivariate kernel density estimator
% with diagonal bandwidth matrix.
% The kernel is assumed to be Gaussian.
% The two bandwidth parameters are
% chosen optimally without ever
% using/assuming a parametric model for the data or any “rules of thumb“.
% Unlike many other procedures this one
% is immune to accuracy failures in the estimation of
% multimodal densities with widely separated modes (see examples).
% INPUTS: data - an N by 2 array with continuous data
%            n - size of the n by n grid over which the density is computed
%                n has to be a power of 2 otherwise n=2^ceil(log2(n));
%                the default value is 2^8;
% MIN_XYMAX_XY- limits of the bounding box over which the density is computed;
%                the format is:
%                MIN_XY=[lower_Xlimlower_Ylim]
%                MAX_XY=[upper_Xlimupper_Ylim].
%                The dafault limits are computed as:
%                MAX=max(data[]1); MIN=min(data[]1); Range=MAX-MIN;
%                MAX_XY=MAX+Range/4; MIN_XY=MIN-Range/4;
% OUTPUT: bandwidth - a row vector with the two optimal
%                     bandwidths for a bivaroate Gaussian kernel;
%                     the format is:
%                     bandwidth=[bandwidth_X bandwidth_Y];
%          density  - an n by n matrix containing the density values over the n by n grid;
%                     density is not computed unless the function is asked for such an output;
%              XY  - the meshgrid over which the variable “density“ has been computed;
%                     the intended usage is as follows:
%                     surf(XYdensity)
% Example (simple Gaussian mixture)
% clear all
%   % generate a Gaussian mixture with distant modes
%   data=[randn(5002);
%       randn(5001)+3.5 randn(5001);];
%   % call the routine
%     [bandwidthdensityXY]=kde2d(data);
%   % plot the data and the density estimate
%     contour3(XYdensity50) hold on
%     plot(data(:1)data(:2)‘r.‘‘MarkerSize‘5)
%
% Example (Gaussian mixture with distant modes):
%
% clear all
%  % generate a Gaussian mixture with distant modes
%  data=[randn(1001) randn(1001)/4;
%      randn(1001)+18 randn(1001);
%      randn(1001)+15 randn(1001)/2-18;];
%  % call the routine
%    [bandwidthdensityXY]=kde2d(data);
%  % plot the data and the density estimate
%  surf(XYdensity‘Linestyle‘‘none‘) view([060])
%  colormap hot hold on alpha(.8)
%  set(gca ‘color‘ ‘blue‘);
%  plot(data(:1)data(:2)‘w.‘‘MarkerSize‘5)
%
% Example (Sinusoidal density):
%
% clear all
%   X=rand(10001); Y=sin(X*10*pi)+randn(size(X))/3; data=[XY];
%  % apply routine
%  [bandwidthdensityXY]=kde2d(data);
%  % plot the data and the density estimate
%  surf(XYdensity‘Linestyle‘‘none‘) view([070])
%  colormap hot hold on alpha(.8)
%  se
属性 大小 日期 时间 名称
----------- --------- ---------- ----- ----
文件 342 2016-01-26 15:49 run.m
文件 7762 2015-12-30 18:46 kde2d.m
文件 1540 2015-12-30 18:46 license.txt
----------- --------- ---------- ----- ----
9644 3
 川公网安备 51152502000135号
评论
共有 条评论