资源简介
高斯过程回归源码 及结果展示

代码片段和文件信息
% Calculates for xstar x-coordinates the bestEstimate and the 95%
% confidence interval (bounds) for a Gaussian process regression.
% Mark Ebden July 2008
%
% Inputs:
%  k - a handle to the covariance function
%  Xy - the training data x- and y-coordinates
%  theta - the GP parameters to be passed to the covariance function
%          (e.g. length scale periodicity etc.
%  sigma_n - the noise (optional -- default 0)
%    NOTE: sigma_n should be left as zero if k *already* includes the noise term as I usually do.
%  xstar - specify the x-coordinates to solve for (optional -- default is
%          to let the algorithm choose them)
%  graphing - produce a plot of results (optional)
%             Default is to plot the results unless the function outputs were asked for
%
% Outputs:
%  xstar - x-coordinates (default 100 are chosen)
%  K - covariance matrix among training data
%  V - variance at each xstar

function [xstar bestEstimate bounds K V] = calcGP (k X y theta sigma_n xstar graphing)

if nargin < 7
    if nargout == 0
        graphing = 1;
    else
        graphing = 0;
    end
end
if nargin < 6 || ~any(xstar)
    r2 =(max(X)-min(X));
    N = 1e3; % How many points to use
    z = .5; % How much to extend the time series on either side (e.g. .5 is 50% extension on left and on right)
    xstar = (0:N)/N * (z*2+1)*r2 + min(X)-r2*z;
end
if nargin < 5
    sigma_n = 0;
end
if nargin < 4
    theta = [1 0 1 0];
end

% a) Initializations
meany = mean(y); y = y - meany;
n = size(X1); lx = length(xstar);
K = zeros(n); kstar = zeros(n1);
for i = 1:n
    for j = 1:n
        K(ij) = k (X(i)X(j)theta);
    end
end
fstarbar = zeros(lx1); V = zeros(lx1);

% b) One-off calculations
diags = max(1e3*eps sigma_n^2); % beef up the diagonal if sigma_n = 0
L = chol (K + diags*eye(n)‘lower‘);
alpha = L‘\(L\y);
logpyX = -y‘*alpha/2 - sum(log(diag(L))) - n*log(2*pi)/2; % Log marginal likelihood

% c) xstar loop
for q = 1:lx
    for i = 1:n
        kstar(i) = k (X(i)xstar(q)theta);
    end
    kstar
    % Mean of prediction
    fstarbar(q) = kstar‘ * alpha;
    % Variance of prediction
    v = L\kstar;
    ystar_noise = sigma_n^2; % recall f* has no noise itself (Algorithm 2.1 on p 19 of H152)
    V(q) = k (xstar(q)xstar(q)theta) - v‘*v + ystar_noise;
end
bounds = [fstarbar+1.96*sqrt(V) fstarbar-1.96*sqrt(V)]+meany;
bestEstimate = fstarbar+meany;

% d) Output
if graphing == 1
    figure hold on
    stdRegion (xstarbounds)
    plot (xstarbestEstimate‘k‘)
    plot (Xy+meany‘b+‘)
end
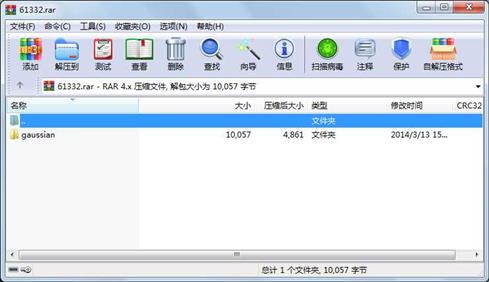
属性 大小 日期 时间 名称
----------- --------- ---------- ----- ----
文件 2919 2012-10-27 12:15 gaussian\GPtutorial.m
文件 2043 2011-03-31 11:51 gaussian\GPtutorialFcn.m
文件 509 2011-02-03 12:23 gaussian\hypSample.m
文件 1436 2010-11-09 18:03 gaussian\k_GP.m
文件 599 2012-10-27 12:16 gaussian\stdRegion.m
文件 2551 2012-04-27 14:23 gaussian\calcGP.m
目录 0 2014-03-13 15:35 gaussian
----------- --------- ---------- ----- ----
10057 7
- 上一篇:六足机器人控制程序
- 下一篇:PS2+ arduino+接线图+源码
相关资源
- GPRS(MC35型号)的发送短信程序
- 基于ARM和GPRS的无线通信系统设计
- Post Processing Profiles 3.1
- 易语言U盘锁源码
- 基于PLC、GPRS以及ZigBee的路灯无线控制
- 一种远程无线抄表系统的设计方案
- 基于Zigbee和GPRS的无线温湿度测量系统
- 收发短信,短信控制LED51单片机例程
- 基于LINUX与GPRS网络的无线数据采集与
- 华为 GTM900才模块资料大全
- 一个用C写很不错的GPRS的PDU编码程序
- GSM GPRS Modem USB驱动
- SIM7600CE-4G模块资料.rar
- 基于北斗/GPS双星和GSM/GPRS通信的车辆
- linux下面使用SIM300模块发送GPRS短信的
- GA6 gprs模块 51单片机 程序
- 温度、一氧化碳、二氧化碳、PM2.5以及
- STM32F单片机与SIM900A的硬件条件下读一
- HUAWEI MG323
- Air202 硬件设计手册
- gprsprotel仿真
- Gprint 条码机 TSPL 中文编程手册蓝牙打
- STM32的SIM900A的GPRS数据传输
- 灵期通讯软件
- 用友政务GRP-U8,近期常见问题85例解决
- GPRS编程DTU资料
- stm32f407 GPRS通信源码
- ucos+sim908+GPRS+GPS
- GPRS 模块 原理图
- 移远通信国网4G模块资料
 川公网安备 51152502000135号
评论
共有 条评论