资源简介
爬取淘宝某个店铺的商品信息,并根据商品销量,用商品图片做矩阵树图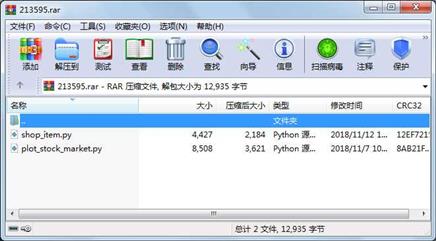
代码片段和文件信息
“““
=======================================
Visualizing the stock market structure
=======================================

This example employs several unsupervised learning techniques to extract
the stock market structure from variations in historical quotes.

The quantity that we use is the daily variation in quote price: quotes
that are linked tend to cofluctuate during a day.

.. _stock_market:

Learning a graph structure
--------------------------

We use sparse inverse covariance estimation to find which quotes are
correlated conditionally on the others. Specifically sparse inverse
covariance gives us a graph that is a list of connection. For each
symbol the symbols that it is connected too are those useful to explain
its fluctuations.

Clustering
----------

We use clustering to group together quotes that behave similarly. Here
amongst the :ref:‘various clustering techniques ‘ available
in the scikit-learn we use :ref:‘affinity_propagation‘ as it does
not enforce equal-size clusters and it can choose automatically the
number of clusters from the data.

Note that this gives us a different indication than the graph as the
graph reflects conditional relations between variables while the
clustering reflects marginal properties: variables clustered together can
be considered as having a similar impact at the level of the full stock
market.

embedding in 2D space
---------------------

For visualization purposes we need to lay out the different symbols on a
2D canvas. For this we use :ref:‘manifold‘ techniques to retrieve 2D
embedding.


Visualization
-------------

The output of the 3 models are combined in a 2D graph where nodes
represents the stocks and edges the:

- cluster labels are used to define the color of the nodes
- the sparse covariance model is used to display the strength of the edges
- the 2D embedding is used to position the nodes in the plan

This example has a fair amount of visualization-related code as
visualization is crucial here to display the graph. One of the challenge
is to position the labels minimizing overlap. For this we use an
heuristic based on the direction of the nearest neighbor along each
axis.
“““
from __future__ import print_function

# Author: Gael Varoquaux gael.varoquaux@normalesup.org
# License: BSD 3 clause

import sys
from datetime import datetime

import numpy as np
import matplotlib.pyplot as plt
from matplotlib.collections import LineCollection

import pandas as pd

from sklearn import cluster covariance manifold

print(__doc__)


# #############################################################################
# Retrieve the data from Internet

# The data is from 2003 - 2008. This is reasonably calm: (not too long ago so
# that we get high-tech firms and before the 2008 crash). This kind of
# historical data can be obtained for from APIs like the quandl.com and
# alphavantage.co ones.
start_date = datetime(2003 1 1).date()
end_date = datetime(2008 1 1).date()

symbol_di
属性 大小 日期 时间 名称
----------- --------- ---------- ----- ----
文件 8508 2018-11-07 10:16 plot_stock_market.py
文件 4427 2018-11-12 17:06 shop_item.py
----------- --------- ---------- ----- ----
12935 2
相关资源
- 很好用的网站前端页面爬取工具
- 戴尔解决方案助力阿里巴巴旗下&ldq
- 自定义VIewGroup实现仿淘宝商品详情页
- rockchip rv1108和rk3288资料,淘宝28买的
- 易语言淘宝助手2源码易语言淘宝助手
- 淘宝秒杀抢拍器 v1.0 绿色版.rar
- 爬取豆瓣电影TOP250程序,包含非常详
- Web Scraper 爬虫 网页抓取 Chrome插件
- 淘宝直通车关键词查询工具 v1.1.4.0.
- 淘宝高质量客户营销系统(采集打标
- 淘你妹淘宝店铺数据采集大师 v1.0
- 淘宝注册软件|谷跑淘宝注册软件v1.
- 天音淘宝店铺宝贝批量复制大师V3.2
- 淘宝后台完整类目-从一级类目到五级
- 淘宝客微信小程序前后台完整源码
- 省市区三级联动JS代码仿淘宝收货地址
- 爬取新浪微博上的妹纸照片的爬虫程
- 中国行政区划到村总.txt
- 购物商城app 仿淘宝
- 仿淘宝收货地址
- 淘宝抢拍器v1.0绿色免费版
- 高仿淘宝收货地址
- Lucene(搜索)Demo
- 淘宝小号账号状态检测软件
- 淘宝客整站源码
- 机械主题爬虫的设计与实现
- 天猫淘宝秒杀抢购插件
- 模拟登录一些常见的网站
- Mindmanager模板素材446个淘宝买的史上最
- NBA数据爬虫
 川公网安备 51152502000135号
评论
共有 条评论