资源简介
亲测可运行的teqc画图分析软件,注意:请查看自己的teqc数据分析结果里有没有数字1被当作字母I的,若有将其全部替换为数字1,否则teqcplot无法运行。(亲身经验哦)

代码片段和文件信息
function out=teqcplot(files);
% TEQCPLOT Read and plot TEQC report files
%
% TEQC is the Toolkit for GPS/GLONASS/SBAS Data used to solve
% many pre-processing problems with GPS GLONASS and SBAS data:
% TEQC stands for Translation Editing and Quality Check
% More info here: http://facility.unavco.org/software/teqc/teqc.html
%
% TEQCPLOT(FILENAME) returns the content of a TEQC reportfile in
% a figure (and a struct variable).
% Input argument FILENAME is optional.
%
% Valid TEQC report files are:
%
% FORMAT DEscriptION
% *.sn1 Signal to noise ratio (S/N) Carrier L1
% *.sn2 Signal to noise ratio (S/N) Carrier L2
% *.iod Derivative of ionospheric delay observable (m/s)
% *.ion Ionospheric delay observable (m)
% *.mp1 Multipath Carrier L1
% *.mp2 Multipath Carrier L2
% *.azi Satellite azimuthal data (degrees)
% *.ele Satellite elevation data (degrees)
%
% Jim Hedfors Uppsala University 2005
% Comments and requests for more TEQC Matlab tools to:
% jim.hedfors@gmail.com
% FUNCTION: READER & PLOTTER ++++++++++++++++++++++++++++++++++++++++++++++
if nargin==0
[filenpath]=uigetfile(‘*.sn1;*.sn2;*.iod;*.ion;*.mp1;*.mp2;*.azi;*.ele‘...
‘Pick your TEQC report file‘);
else
[pathfilenext]=fileparts(files);
path=[path ‘\‘];
filen={[filen ext]};
end
file=char(filen);
%[A]=importdata([path file]‘\t‘);
A=textread([path file] ‘%s‘‘whitespace‘‘\n‘)
SAT(1:length(A)1:32)=NaN;
n=0;i=5;
sats=str2num(A{i});
snyggfilen=strrep(filen‘_‘‘-‘);
h=waitbar(0[‘Please wait... Importing ‘ char(snyggfilen)]);
while i
n=n+1;
i=i+1;
if sats~=0;
SAT(nsats(2:end))=str2num(A{i});
i=i+1;
end
if str2num(A{i})~=-1;
sats=str2num(A{i});
end
end
close(h);
sat=SAT(1:n+1:);
t_samp=char(A(3));
mjl=char(A(4));
T_SAMP=str2num(t_samp(max(find(t_samp==‘ ‘)):end));
MJL_START=str2num(mjl(max(find(mjl==‘ ‘)):end));
MJL(1)=MJL_START;
for i=2:length(sat);
MJL(i)=MJL_START+i*T_SAMP/60/60/24;
end
JD=mjl2jd(MJL);
[typemaxyminy]=get_filetype(file);
figure;box on;hold on
pcolor(JD‘1:32sat‘)
set(gcf‘renderer‘‘zbuffer‘);
shading flat
set(gca‘xticklabel‘[JD]);
set(gca‘xlim‘[JD(1) JD(end)])
dateaxis(‘X‘13)
cbar(‘v‘[miny maxy]type);
set(gca‘ylim‘[1 33])
set(gca‘ytick‘[1.5:1:32.5])
set(gca‘yticklabel‘[‘S01‘;‘S02‘;‘S03‘;‘S04‘;‘S05‘;‘S06‘;...
‘S07‘;‘S08‘;‘S09‘;‘S10‘;‘S11‘;‘S12‘;...
‘S13‘;‘S14‘;‘S15‘;‘S16‘;‘S17‘;‘S18‘;...
‘S19‘;‘S20‘;‘S21‘;‘S22‘;‘S23‘;‘S24‘;...
‘S25‘;‘S26‘;‘S27‘;‘S28‘;‘S29‘;‘S30‘;...
‘S31‘;‘S32‘]);
set(gca‘fontsize‘7);
colormap(flipud(jet));
caxis([miny maxy]);
xlabel([datestr(JD(1)) ‘ |-------- T Samp: ‘ num2str(T_SAMP) ‘ s --------| ‘ datestr(JD(end))])
ylabel(‘SVS‘)
timestr=secs2hms(length(sat));
T=title([‘TEQC Report file: ‘ strrep(fi 属性 大小 日期 时间 名称
----------- --------- ---------- ----- ----
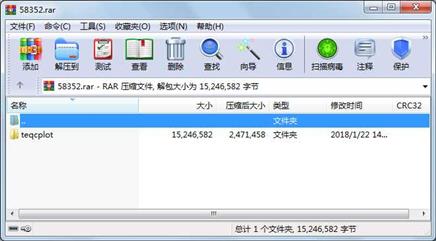
文件 7527768 2018-01-22 14:22 teqcplot\result.ion
文件 7527768 2018-01-22 14:19 teqcplot\result.mp1
文件 184937 2006-05-12 15:10 teqcplot\rover.sn2
文件 6109 2017-09-04 15:17 teqcplot\teqcplot.m
目录 0 2018-01-22 14:25 teqcplot
----------- --------- ---------- ----- ----
15246582 5
 川公网安备 51152502000135号
评论
共有 条评论