资源简介
上述代码是利用python内置的k-means聚类算法对鸢尾花数据的聚类效果展示,注意在运行该代码时需要采用pip或者其他方式为自己的python安装sklearn以及iris扩展包,其中X = iris.data[:]表示我们采用了鸢尾花数据的四个特征进行聚类,如果仅仅采用后两个(效果最佳)则应该修改代码为X = iris.data[2:]

代码片段和文件信息
#!/usr/bin/python
# -*- coding: UTF-8 -*-
#############K-means-鸢尾花聚类############
import matplotlib.pyplot as plt
import numpy as np
from sklearn.cluster import KMeans
from sklearn import datasets
from sklearn.datasets import load_iris
iris = load_iris()
X = iris.data[:] ##表示我们只取特征空间中的后两个维度
#print(X)
print(X.shape)
#绘制数据分布图
plt.scatter(X[: 0] X[: 1] c = “red“ marker=‘o‘ label=‘see‘)
plt.xlabel(‘petal length‘)
plt.ylabel(‘petal width‘)
plt.legend(loc=2)
plt.show()


estimator = KMeans(n_clusters=3)#构造聚类器
estimator.fit(X)#聚类
label_pred = estimator.labels_ #获取聚类标签
#绘制k-means结果
x0 = X[label_pred == 0]
x1 = X[label_pred == 1]
x2 = X[label_pred == 2]
plt.scatter(x0[: 0] x0[: 1] c = “red“ marker=‘o‘ label=‘label0‘)
plt.scatter(x1[: 0] x1[: 1] c = “green“ marker=‘*‘ label=‘label1‘)
plt.scatter(x2[: 0] x2[: 1] c = “blue“ marker=‘+‘ label=‘label2‘)
plt.xlabel(‘petal length‘)
plt.ylabel(‘petal width‘)
plt.legend(loc=2)
plt.show()
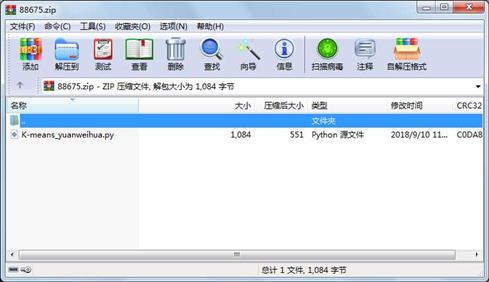
属性 大小 日期 时间 名称
----------- --------- ---------- ----- ----
文件 1084 2018-09-10 11:21 K-means_yuanweihua.py
相关资源
- 二级考试python试题12套(包括选择题和
- pywin32_python3.6_64位
- python+ selenium教程
- PycURL(Windows7/Win32)Python2.7安装包 P
- 英文原版-Scientific Computing with Python
- 7.图像风格迁移 基于深度学习 pyt
- 基于Python的学生管理系统
- A Byte of Python(简明Python教程)(第
- Python实例174946
- Python 人脸识别
- Python 人事管理系统
- 基于python-flask的个人博客系统
- 计算机视觉应用开发流程
- python 调用sftp断点续传文件
- python socket游戏
- 基于Python爬虫爬取天气预报信息
- python函数编程和讲解
- Python开发的个人博客
- 基于python的三层神经网络模型搭建
- python实现自动操作windows应用
- python人脸识别(opencv)
- python 绘图(方形、线条、圆形)
- python疫情卡UN管控
- python 连连看小游戏源码
- 基于PyQt5的视频播放器设计
- 一个简单的python爬虫
- csv文件行列转换python实现代码
- Python操作Mysql教程手册
- Python Machine Learning Case Studies
- python获取硬件信息
 川公网安备 51152502000135号
评论
共有 条评论