资源简介
包含四个程序,分别从dat文件,txt文件,csv文件,xls文件中读取数据,并利用MIC算法进行数据关联性挖掘,后以图片形式呈现结果。文件包含源码和测试数据。

代码片段和文件信息
from __future__ import division
import numpy as np
import matplotlib.pyplot as plt
from minepy import MINE
import xlrd
import csv
import pandas as pd

def micsubplot(xynumRowsnumColsplotNum
              xlim=(-44)ylim=(-44)):
    r=np.around(np.corrcoef(x y)[01]1)
    mine=MINE(alpha=0.5c=15)
    mine.compute_score(xy)
    mic=mine.mic()
    ax=plt.subplot(numRowsnumColsplotNum
                   xlim=xlimylim=ylim)
    ax.set_title(‘Person r=%.1f\MIC=%.1f‘ % (rmic)fontsize=10)
    ax.set_frame_on(False)
    ax.axes.get_xaxis().set_visible(True)
    ax.axes.get_yaxis().set_visible(True)
    ax.plot(xy‘+‘)
    ax.set_xticks([])
    ax.set_yticks([])
    return ax
‘‘‘
n=800
x1 = np.random.uniform(-1 1 n)
y1 = 4*(x1**2-0.5)**2 + np.random.uniform(-1 1 n)/3

cors = [1.0 0.8 0.4 0.0 -0.4 -0.8 -1.0]
for i cor in enumerate(cors):
    cov = [[1 cor][cor 1]]
    xy = np.random.multivariate_normal([0 0] cov n)
    x2=xy[: 0]
    y2=xy[: 1]

‘‘‘
# read .xls files and calculat the MIC value
xlsfile = r“.\text1.xls“
book = xlrd.open_workbook(xlsfile)
sheet0 = book.sheet_by_index(0)
#print “1“sheet0
sheet_name = book.sheet_names()
#print “2“sheet_name
#sheet1 = book.sheet_by_name(sheet_name)
nrows = sheet0.nrows
#print “3“nrows
ncols = sheet0.ncols
#print “4“ncols
‘‘‘
col_data_x1=[]
col_data_y1=[]
col_data_x2=[]
col_data_y2=[]
‘‘‘
xlsdata=[]
for i in range(nrows):
    xlsdata.append(sheet0.row_values(i))
print xlsdata
x1=[x[0] for x in xlsdata]
y1=[x[1] for x in xlsdata]
x2=[x[2] for x in xlsdata]
y2=[x[3] for x in xlsdata]
‘‘‘
col_data_x1 = sheet0.col_values(0)
col_data_y1 = sheet0.col_values(1)
col_data_x2 = sheet0.col_values(2)
col_data_y2 = sheet0.col_values(3)
‘‘‘
#print “5“col_data
#print len(col_data)
x1=x1[1:len(x1)]
y1=y1[1:len(y1)]
x2=x2[1:len(x2)]
y2=y2[1:len(y2)]

‘‘‘
print len(x1)len(y1)len(x2)len(y2)
print ‘\n‘
print x1
print y1
print x2
print y2
‘‘‘


micsubplot(x1 y1 1 2 1 (-1 1) (-1/3 1+1/3))
micsubplot(x2 y2 1 2 2)
plt.tight_layout()
plt.show()

# read .csv files and calculat the MIC value
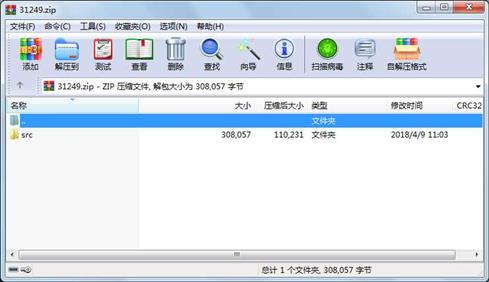
属性 大小 日期 时间 名称
----------- --------- ---------- ----- ----
目录 0 2018-04-09 11:03 src\
文件 2192 2018-03-13 18:04 src\MIC_calculation2.py
文件 3545 2018-04-03 11:56 src\MIC_csv.py
文件 1673 2018-04-09 11:03 src\MIC_dat.py
文件 1606 2018-03-13 17:57 src\MIC_txt.py
文件 2131 2018-03-13 17:59 src\MIC_xls.py
文件 50163 2018-03-12 14:20 src\text1.csv
文件 100328 2018-03-12 14:22 src\text1.dat
文件 50163 2018-03-13 14:24 src\text1.txt
文件 96256 2018-03-11 23:20 src\text1.xls
 川公网安备 51152502000135号
评论
共有 条评论