资源简介
原创毕业设计完工贴出来和大家分享一下吧-metro_simulation.rar
我的毕业设计是做一个地铁列车运行过程的仿真系统。当然,不是很复杂。在simulink里面建立模型,然后用GUI对其中变量进行赋值,并通过GUI中的一段函数对制动点进行试凑,最后显示出列车的速度-路程曲线,行驶总路程和时间。
-------------------------------------------
现将GUI中所调用的功能及其实现方法整理如下:
1、点击按钮,切换GUI。这个现实起来很简单,只要在按扭的callback函数里写上run; close;即可。
2、把GUI中edit框中的数值赋给simulink中对应的变量。这个问题一开始困扰了我好一段时间,看了很多例子都不行,有人说用set_param,但我用了之后总是会报错说变量没有定义。其实,只需要用等号对变量名进行赋值即可。例如:simulink中某个变量为M,edit框的确Tag为name,那么相应的代码就是M=str2double);这里的str2double是将字符串转变为double型的双精度数。调用simulink前写上options = simset;再进行调用sim;
3、从excel中读取数据,并将其赋给对应的edit框。这个在math大哥的视频里已经有详细解析了,这里就不缀述了。
4、将GUI中的参数保存进excel文件中,这个与读取过程类似,不过用的函数是uiputfile和xlswrite,具体的到matlab帮助里看一下就可以了,里面写得非常清楚。
5、将最后的仿真结果绘制出来。这个实现起来相对比较麻烦。首先在simulink里要添加"to workspace"模块(注意save format一定要选择Array)。然后在调用simulink仿真的语句后面,用assignin函数将"to workspace"输出的数据保存在workspace中的向量中,例如assignin; result是输出的结果,k1是保存的向量名。在调用k1进行画图的时候,需要用evalin函数将k1从工作空间中读取出来,如k2=evalin。
如果输出的结果是最终的一个数,而非一个数组,则可以用result来获取,这里的t是仿真时间长度,step为仿真步长。
----------------------
我用到的GUI主要部分就是这些,希望能对大家有些帮助。GUI入手的确比较困难,但只要多看几个例子,问题就会迎仞而解。ilovematlab论坛的确给我们提供了一个良好的平台,从这里学到了很多有用的东西。
----------------------------------
----------------------------------
附件中是我的源程序,运行时先从preface开始。
1.jpg
2.jpg
3.jpg
4.jpg

代码片段和文件信息
function varargout = graph(varargin)
% GRAPH M-file for graph.fig
%      GRAPH by itself creates a new GRAPH or raises the existing
%      singleton*.
%
%      H = GRAPH returns the handle to a new GRAPH or the handle to
%      the existing singleton*.
%
%      GRAPH(‘CALLBACK‘hobjecteventDatahandles...) calls the local
%      function named CALLBACK in GRAPH.M with the given input arguments.
%
%      GRAPH(‘Property‘‘Value‘...) creates a new GRAPH or raises the
%      existing singleton*.  Starting from the left property value pairs are
%      applied to the GUI before graph_OpeningFunction gets called.  An
%      unrecognized property name or invalid value makes property application
%      stop.  All inputs are passed to graph_OpeningFcn via varargin.
%
%      *See GUI Options on GUIDE‘s Tools menu.  Choose “GUI allows only one
%      instance to run (singleton)“.
%
% See also: GUIDE GUIDATA GUIHANDLES

% Copyright 2002-2003 The MathWorks Inc.

% Edit the above text to modify the response to help graph

% Last Modified by GUIDE v2.5 25-Mar-2002 12:19:15

% Begin initialization code - DO NOT EDIT
gui_Singleton = 1;
gui_State = struct(‘gui_Name‘       mfilename ...
                   ‘gui_Singleton‘  gui_Singleton ...
                   ‘gui_OpeningFcn‘ @graph_OpeningFcn ...
                   ‘gui_OutputFcn‘  @graph_OutputFcn ...
                   ‘gui_LayoutFcn‘  []  ...
                   ‘gui_Callback‘   []);
if nargin && ischar(varargin{1})
    gui_State.gui_Callback = str2func(varargin{1});
end

if nargout
    [varargout{1:nargout}] = gui_mainfcn(gui_State varargin{:});
else
    gui_mainfcn(gui_State varargin{:});
end
% End initialization code - DO NOT EDIT


% --- Executes just before graph is made visible.
function graph_OpeningFcn(hobject eventdata handles varargin)
% This function has no output args see OutputFcn.
% hobject    handle to figure
% eventdata  reserved - to be defined in a future version of MATLAB
% handles    structure with handles and user data (see GUIDATA)
% varargin   command line arguments to graph (see VARARGIN)

% Choose default command line output for graph
handles.output = hobject;
axes(handles.axes3);
distance=evalin(‘base‘‘k1‘);
velocity=evalin(‘base‘‘k2‘);
plot(distancevelocity);
xlabel(‘Distance (m)‘);
ylabel(‘Velocity (km/h)‘);
title(‘Figure of Velocity against Distance‘);
grid on;
axes(handles.axes4);
t=evalin(‘base‘‘k3‘);
plot(tvelocity);
xlabel(‘Time (s)‘);
ylabel(‘Velocity (km/h)‘);
title(‘Figure of Velocity against Time‘);
grid on;

% Update handles structure
guidata(hobject handles);

% UIWAIT makes graph wait for user response (see UIRESUME)
% uiwait(handles.figure1);


% --- Outputs from this function are returned to the command line.
function varargout = graph_OutputFcn(hobject eventdata handles)
% varargout  cell array for returning output args (see VARARGOUT);
% hobject    hand
属性 大小 日期 时间 名称
----------- --------- ---------- ----- ----
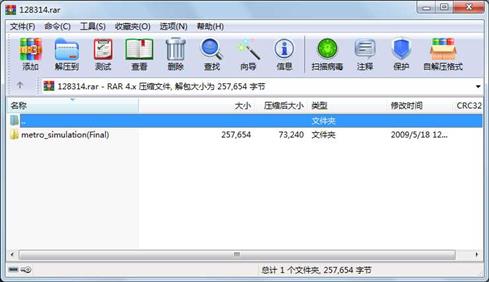
文件 13824 2009-05-16 12:32 metro_simulation(Final)\ABC.xls
文件 13824 2009-05-14 19:25 metro_simulation(Final)\file2.xls
文件 36163 2009-05-16 19:27 metro_simulation(Final)\graph.fig
文件 3240 2009-05-15 22:48 metro_simulation(Final)\graph.m
文件 10142 2009-05-16 14:13 metro_simulation(Final)\main.fig
文件 33033 2009-05-16 16:04 metro_simulation(Final)\main.m
文件 127680 2009-05-16 19:35 metro_simulation(Final)\metro_simulation.mdl
文件 14336 2009-05-14 18:52 metro_simulation(Final)\parameter.xls
文件 2205 2009-05-18 12:38 metro_simulation(Final)\preface.fig
文件 3207 2009-05-11 10:35 metro_simulation(Final)\preface.m
目录 0 2009-05-18 12:37 metro_simulation(Final)
----------- --------- ---------- ----- ----
257654 11
相关资源
- matlab_OFDM调制解调(来自剑桥大学)
- Matlab路面裂缝识别69319
- 高灵敏度GPS接收机MATLAB仿真,附捕获
- 基于MATLAB的质点弹道计算与外弹道优
- 阵列天线的matlab仿真
- MATLAB 经典程序源代码大全
- MATLAB小波软阈值去噪代码33473
- 天线阵的波束形成在MATLAB仿真程序及
- 非线性SVM算法-matlab实现
- 《MATLAB 智能算法超级学习手册》-程序
- 组合导航matlab程序
- 读取txt文件内容matlab代码实现
- Matlab实现基于相关的模板匹配程序
- matlab优化工具箱讲解
- 基于MATLAB的快速傅里叶变换
- 光纤传输中的分布傅立叶算法matlab实
- 基于matlab的图像处理源程序
- matlab 椭圆拟合程序
- 算术编码解码matlab源代码
- optical_flow 光流法 matlab 实现程序
- 引导图像滤波器 Matlab实现
- 分形几何中一些经典图形的Matlab画法
- OFDM系统MATLAB仿真代码
- SVM工具箱(matlab中运行)
- 图像小波变换MatLab源代码
- LU分解的MATLAB实现
- 冈萨雷斯数字图像处理matlab版(第三
- 替代数据法的matlab程序
- 用matlab实现的多站定位系统性能仿真
- 通过不同方法进行粗糙集属性约简m
 川公网安备 51152502000135号
评论
共有 条评论