资源简介
matlab各种功率谱画法及比较 matlab各种功率谱画法及比较

代码片段和文件信息
%%%%%%%%%%%%%%%%%%%%%%%%%%%%%%%%%%%%%%%%%%%%%%%%%%%%%%%%%%%%%%%%%%%%%%%
%%%%%用不同的方法绘制功率谱并比较%%%%%%%%%%%%%%%%%%%%%%%%%%%%%%%%%%%%%%%%
%%%%%2017/11/13                %%%%%%%%%%%%%%%%%%%%%%%%%%%%%%%%%%%%%%%%
clc;clear;close all;
%% 定义信号及基础变量
Fs = 5000;                    %采样频率5000Hz
T = 1/Fs;                     %采样周期
L = 1000;                     %信号长度
t = (0:L-1)*T;                %时间向量
xn0 = 10*sin(2*pi*100*t);     %原始信号
xn  = xn0 + randn(size(t));   %加噪声信号
%% 信号时域图
figure(1)
f1 = subplot(211);
plot(f1txn0);
axis([00.01-1515]);
title(‘原始信号波形‘);
f2 = subplot(212);
plot(f2txn);
axis([0 0.01 -15 15]);
title(‘加高斯噪声信号‘);
%% fft画功率谱
figure(‘Numbertitle‘ ‘off‘ ‘Name‘ ‘fft画功率谱‘);
subplot(211);
Pxx=10*log10((abs(fft(xn01024))/512).^2);
f = Fs/2*linspace(01513);
figure(2)
plot(fPxx(1:513));
ylim([-100100]);
title(‘原始信号功率谱‘);
grid
subplot(212);
Pxx=10*log10((abs(fft(xn1024))/512).^2);
f = Fs/2*linspace(01513);
plot(fPxx(1:513));
ylim([-100100]);
grid
title(‘噪声信号功率谱‘);
%% 周期图法与平均周期图法
figure(‘Numbertitle‘ ‘off‘ ‘Name‘ ‘周期图法‘);
Hrect = spectrum.periodogram();
subplot(311);psd(Hrectxn‘Fs‘Fs‘NFFT‘1024);
title(‘周期图法\_—矩形窗‘);
Hrect = spectrum.periodogram(‘hamming‘);
subplot(312);psd(Hrectxn‘Fs‘Fs‘NFFT‘1024);
title(‘周期图法-汉明窗‘);
Hrect = spectrum.welch(‘rectangular‘10075);
subplot(313);psd(Hrectxn‘Fs‘Fs‘NFFT‘512);
title(‘平均周期图法‘);
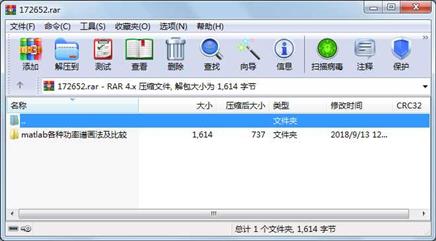
属性 大小 日期 时间 名称
----------- --------- ---------- ----- ----
文件 1559 2018-09-13 10:04 matlab各种功率谱画法及比较\a.m
文件 55 2018-08-27 11:33 matlab各种功率谱画法及比较\【源码使用必读】.url
目录 0 2018-09-13 12:52 matlab各种功率谱画法及比较
----------- --------- ---------- ----- ----
1614 3
相关资源
- matlab_OFDM调制解调(来自剑桥大学)
- Matlab路面裂缝识别69319
- 高灵敏度GPS接收机MATLAB仿真,附捕获
- 基于MATLAB的质点弹道计算与外弹道优
- 阵列天线的matlab仿真
- MATLAB 经典程序源代码大全
- MATLAB小波软阈值去噪代码33473
- 天线阵的波束形成在MATLAB仿真程序及
- 非线性SVM算法-matlab实现
- 《MATLAB 智能算法超级学习手册》-程序
- 组合导航matlab程序
- 读取txt文件内容matlab代码实现
- Matlab实现基于相关的模板匹配程序
- matlab优化工具箱讲解
- 基于MATLAB的快速傅里叶变换
- 光纤传输中的分布傅立叶算法matlab实
- 基于matlab的图像处理源程序
- matlab 椭圆拟合程序
- 算术编码解码matlab源代码
- optical_flow 光流法 matlab 实现程序
- 引导图像滤波器 Matlab实现
- 分形几何中一些经典图形的Matlab画法
- OFDM系统MATLAB仿真代码
- SVM工具箱(matlab中运行)
- 图像小波变换MatLab源代码
- LU分解的MATLAB实现
- 冈萨雷斯数字图像处理matlab版(第三
- 替代数据法的matlab程序
- 用matlab实现的多站定位系统性能仿真
- 通过不同方法进行粗糙集属性约简m
 川公网安备 51152502000135号
评论
共有 条评论